Ecoblog
Flights and transportation the largest source of emissions in IHME art productions
The carbon footprint for the IHME artworks carried out in 2021 has now been calculated. The carbon footprint of the two art productions is equal to the emissions for one Finn in a year. By far the biggest source of emissions was flying.
The carbon footprint of IHME works is equal to the emissions for one Finn in a year
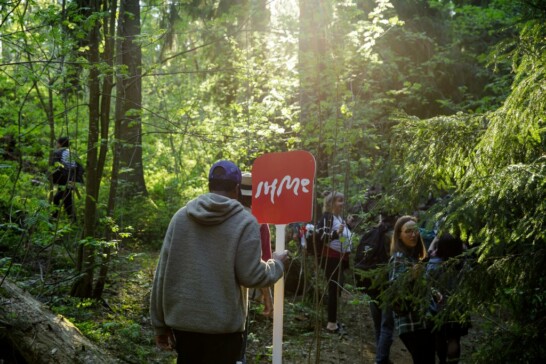
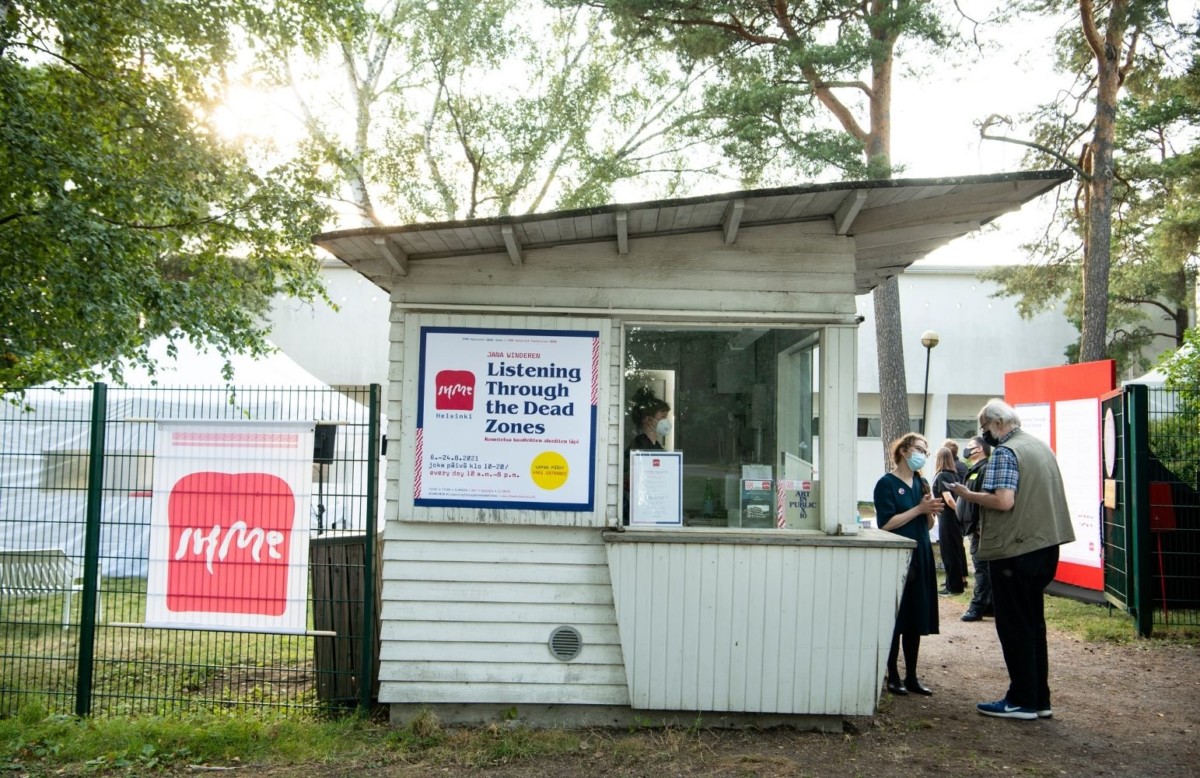
In 2021, IHME Helsinki staged two art productions. Their combined carbon footprint (9 tonnes CO2e) is equal to the average emissions caused by one Finn in a year (10.3 t CO2e). The carbon footprints of Jana Winderen’s sound installation Listening through the Dead Zones and Katie Paterson’s incense ceremonies To Burn, Forest, Fire were approximately 5,000 and 4,000 kg CO2e, respectively. Sequestering these emissions would require 2 hectares of forest, or about 1,400 trees.
Calculated per visitor, the carbon footprint of the sound installation and the incense ceremonies were 1.5 kg CO2e and 3 kg CO2e, respectively. This is roughly equivalent to a 16 km car trip, 100 grams of beef, or 5 kilos of potatoes. One tree would be enough to sequester these emissions, since trees sequester an average of 6 to 7 kilograms of carbon dioxide per year.
Flights and transportation the largest source of emissions due to IHME art productions
Flying was by far the largest source of emissions. Flights accounted for almost 90% of the total emissions caused by the incense ceremonies and more than 50% of the emissions due to the sound installation. If transportation and travel by visitors and staff are included, emissions from travel and mobility rise to more than 90% of the total emissions due to the sound installation.
A decision to avoid flights made in advance and covid-19 pandemic restrictions cut travel emissions. Even a handful of long-haul flights would have significantly increased total emissions. If production of the incense ceremonies had included two round-trip flights to Japan and two to Ecuador, flight emissions alone would have been 30 tonnes and the carbon footprint of the event would have increased sevenfold. IHME chose to keep in touch with the Japanese incense supplier and the Ecuadorian research station via remote connections.
Transportation generated emissions for the sound installation. The speakers rented for the installation were transported from St. Petersburg to Helsinki in a truck carrying no other load. The two round trips caused emissions of about 1 tonne CO2e, which accounted for 25% of the total emissions from the production. However, these emissions were lower than in the alternative scenarios, in which the audio equipment would have been delivered by air cargo from London or Berlin.
Low-emission choices, renting and reuse lowered emissions in marketing
In marketing communications, several choices were made to reduce the ecological burden. Emissions were reduced according to the familiar principle of “refuse, reduce, reuse, recycle”.
Brochure emissions were kept to a minimum by only printing the required number of brochures. The joint brochure for both artworks was printed on low-emission paper and the emissions were offset. The booklet for the incense ceremony was printed on FSC-certified paper – in Finland so as to reduce transport emissions. There were rented poster stands at the venues, as well as IHME signs made several years ago and used repeatedly. To increase event visibility, paper posters were used, some of which had to be replaced with plastic ones when the original posters got wet in the rain. Overall, emissions from print and event visibility were low, less than 1.5% of total production emissions.
Other advertising was done mainly through social media, as well as with electronic digital displays, but also with tram ads. Unfortunately, insufficient reliable data is available on these emissions and so they have not been included in the calculations.
Vegetarian food reduced emissions
If there had only been beef instead of vegetarian and fish meals, ham rolls instead of vegetable rolls and sausages instead of fruit, emissions from food (e.g. catering and dinners) would have doubled. Now, food accounted for a few percent of both productions. Admittedly, meals may account for a greater proportion than the calculator suggests. The default meals in the calculator are closer to school meals than to catered ones or dinner at a restaurant.
Emissions from sound system power consumption 1.1%
At the sound installation, the sound system was on for almost 20 days, consuming a total of 230 kWh of electricity. Heating and coffee-making for audience workers and guards also used electricity at the venue, the Rowing Stadium. Renewable electricity was not available and conventional Helen electricity was used, but the emissions from the sound system were small, 52 kg, or about 1% of the total production emissions. Transportation of the speakers generated about 20 times more emissions than electricity consumption.
Small emissions from conventional taxis, zero emissions from electric taxis
When taxis had to be used during the productions, electric taxis were chosen where possible. Thanks to the use of electric cars, total emissions from taxi rides were 25% smaller than using only conventional taxis run on diesel. Although the share of taxi journeys was small, the percentage reduction in emissions was high. The ability to make tangible choices also increases commitment to the ecological goals of a production.
Carbon footprint of art productions (percentages)
Incense ceremony
Incense ceremony emissions (4000 kg CO2e) calculated using the Hiilifiksu järjestö (Carbon-smart organization) project calculator:
- Travel approximately 95 %
- Flights 88% of total emissions
- Hotel nights 4% of total emissions
- Other mobility and transport 2.3% (Taxi journeys 0.7% of total emissions)
- Other emissions approximately 5 %
- Event facilities 2.2%
- Food and beverage 1.6%
- Brochures 1.5%
- Incense 0.2% (7.7 kg CO2e from the production of 10,000 incense sticks)
- Waste 0%
Sound installation
For the sound installation Listening through the Dead Zones, part of the emissions, 200 kg, were generated in the Baltic Sea-themed kick-off seminar in 2020. These emissions are analysed in the Ecoblog article The carbon footprint of an event. In 2021, the emissions from the sound installation (4700 kg CO2) were calculated using two methods: transport emissions were calculated using the Y-Hiilari calculator, and other emissions using the carbon-smart organization project calculator. Emissions were distributed as follows:
- Travel and transportation 95%
- Flights account for 57.5% of total emissions
- Transportation 25%
- Other mobility (visitors and staff) 12.5% (Taxi journeys 0.7% of total emissions)
- Other emissions 5%
- Food and drink 2.4% of total emissions
- Electricity 1.6% (of which sound electricity 1.1%)
- Purchases (paper and T-shirts) 0.6%
- Waste 0.2%
- Other services such as mailings 0.1%
- Brochures 0%
Conclusions: When art is moved, emissions rise
In carbon footprint calculations it is best not to fiddle with decimal points, but to look at the big picture. The goal must also be borne in mind: IHME wants, through the arts, to provide opportunities for addressing feelings and information related to the environmental crisis, to raise carbon awareness, and to communicate sustainable choices.
The message of the calculation is clear: when art is moved, emissions rise. Movement of the artists and visitors, as well as transportation of the productions, accounted for more than 90% of emissions for both artworks. There are numerous ways of reducing emissions: cutting the need to travel, combining transportation, replacing flights with train or bus journeys, making even greater use of remote connections and replacing international productions with local ones. The next question, then, is how to create high-quality art productions that revise existing art production practices. In the era of climate crisis, the best emissions are those that help reduce total global emissions.
How was the carbon footprint calculated?
The carbon footprint was calculated using the Hiilifiksu järjestö (carbon-smart organization) project calculator. The footprint of transporting the sound installation was calculated using the Finnish Environment Institute’s Y-Hiilari calculator.
Emissions from carbon footprint calculations are divided into categories Scope 1, Scope 2 and Scope 3 according to the Greenhouse Gas Protocol (GHG Protocol). No Scope 1 emissions were generated in the IHME Commissions. This category would have included emission sources owned by IHME itself, for example, if an outdoor event had used electricity from a generator owned by IHME or if the car journeys had been made with cars owned by IHME. However, this was not the case. Scope 2 emissions would have included purchased heat and purchased electricity, but production transactions did not directly involve the purchase of electricity and heat. If only emissions from Scope 1 and Scope 2 had been included in the emissions from the events, the IHME Commissions would have been completely emission-free.
All emissions from the works came under Scope 3, i.e. they were generated through goods and services purchased by IHME. The limitation to “Scope 3” alone does not yet tell us what has been taken into account in the calculations and how accurately emissions from individual services have been calculated. Therefore, it is good to identify which products and services have been taken into account in the calculation and how.
The calculation made with the carbon-smart organization calculator included travel (flights, car journeys, public transport and accommodation), procurement (a user could include paper and 12 different pieces of furniture or equipment), waste by fraction, services and events (use of event facilities by size of space and hours used; postal and cleaning services used, internet use and phone calls in terms of cost in euros; number of meals, litres of beverages, as well as five different groups of products offered free, including brochures and T-shirts). The production emissions include goods and services purchased by IHME Helsinki, but also an estimate of the number of kilometres travelled by visitors.
Certain goods and services could not be included in the calculation. In the absence of a suitable category, the scaffolding for the sound equipment, which was built out of glued laminated timber, could not be included in the calculation. Likewise, the poster stand made out of recycled materials had to be left out. However, transportation of these items was taken into account in the calculations. Emissions related to outsourced or social-media marketing were also not determined.
There are also uncertainties about the input data. Visitor journeys have been estimated from individual feedback and extrapolated to all visitors. Emissions from meals, in turn, have been calculated based on a limited number of simple meals.
Consequently, it is best to consider the results of the carbon-footprint calculation as indicative, and to trust that, in future, tools and methods for carbon footprint calculations will be more standardized, harmonized and comparable, as interest in and need for trustworthy carbon-footprint information grows.
The data collected was also fed into other carbon-footprint calculators. The final result was the same: Flights and transport account for the largest share of emissions from international art production, and most attention should be paid to these two factors when reducing emissions.